I am searching for papers on the variability of climate and its natural variability and possible changes due to climate change. They are hard to find.
The New Climate Dice
This weekend I was reading a potential one: the controversial paper by James Hansen et al. (2012) popularly described as "The New Climate Dice". Its results suggest that variability is increasing. After an op-ed in the Washington Post, this article attracted much attention with multiple reviews on Open Mind (1, 2, 3), Sceptical Science and Real Climate. A Google search finds more than 60 thousand webpages, including rants by the climate ostriches.While I was reading this paper the Berkeley Earth Surface Temperature group send out a newsletter announcing that they have also written two memos about Hansen et al.: one by Wickenburg and one by Hausfather. At the end of the Hausfather memo there is a personal communication by James Hansen that states that the paper did not intend to study variability. That is a pity, but at least saves me the time trying to understand the last figure.
Reinhard Böhm
That means that the best study I know on changes in variability is a beautiful paper by Reinhard Böhm (2012), who unfortunately recently passed away, an enormous loss. His paper is called "changes of regional climate variability in central Europe during the past 250 years". It analyses the high-quality HISTALP dataset. This dataset for the greater Alpine region contains many long time series; many of the earliest observations were performed in this region. Furthermore, this dataset has been very carefully homogenized.Reinhard Böhm finds no change in variability, not for pressure, not for temperature and not for precipitation. His main conclusions are:
- The first result of the study is the clear evidence that there has been no increase of variability during the past 250 years in the region.
- We can show that also this recent anthropogenic normal period [1981-2010, red.] shows no widening of the PDF (probability density function) compared to preceding ones.
- It shows that interannual variability changes show a clear centennial oscillating structure for all three climatic elements [pressure, temperature and precipitation, red.] in the region.
- For the time of being we have no explanation for this empirical evidence.
The variability of climate
Why am I interested in the variability of climate? Well changes in weather extremes have lately gained enormous interest: heat waves, thunderstorms, twisters, winter storms, hurricanes, floods, droughts and so on. Most impacts due to climate change are expected to be due to shifts in extreme events, rather than the mean state of the climate system.I feel that an important question is to which extent changes in the extremes are due to changes in the mean or due to changes in the variability. Thus it is important to understand whether the shape of the distributions of temperature and other essential climate elements are changing, for instance due to changes in the circulation or due to feedbacks. It could also help us understand such feedbacks better. Furthermore, our understanding of what influences the mean is much better as our understanding of what influences the variability of the weather. Thus if the variability is changing, this could hamper our ability to estimate possible climate impacts. (To the climate "sceptics": uncertainty does not mean that nothing will happen.) Finally, if the temperature variability would be increasing strongly, cold extremes may also be attributed to climate change, as the press likes to do, see for example the New York Times on snow in the Middle East. (To the climate "sceptics": also if the variability stays about the same and only the mean temperature is increasing, record cold periods will still occur, they will just become less frequent.)
And, to be honest, I simply like variability. This blog is not called variable variability for nothing. Combined with nonlinear processes, variability can be important for the mean state as well (see for example the example of radiative transfer through clouds) and variability is normally an understudied topic, if only because the university curriculum mainly treats the holy average and linear processes. (It is getting better.)
Methodology
The main beauty of Böhm (2012) is its methodology, which is summarised in the figure below.
Panel a (top left) shows the summer temperature for Basel from 1760 to 2011. With a Gauss filter with a width of 30 years the running mean is computed and show in panel b (top right). If you subtract this running mean from the original data, you end up with the variability depicted in panel c (bottom left). From this variability signal Böhm computed the variability over eight (!) 30-year intervals. He used two variability metrics: IQR-80 and IQR-90. The IQR-80 is the temperature difference between the 10th and the 90th percentile (called the interquantile range) and the IQR-90 is defined analogously. (The 10th percentile is the value below which you can find 10% of the data.) The advantage of using the IQR over the variance or standard deviation is a smaller sensitivity to outliers, for instance the summer of 2003.
With this method Böhm elegantly distinguishes between changes in the mean and changes in the variability. For the decadal changes in the mean (panel b, top right), climatologists already use the word climate variability. Thus a new term is needed to denote the variability studied here. I would suggest simply weather variability. And if the weather variability changes on climatic time scales, this would be climatological weather variability, which you could also call climate intermittence. The word intermittence is often used to denote systems that jump between multiple states; in turbulence research and in (fractal) time series analysis the word intermittence in used in a more general way, like here, to denote signals whose distribution varies.
Results
If you make this calculation over all stations in the three main regions with long time series, you get the figure below.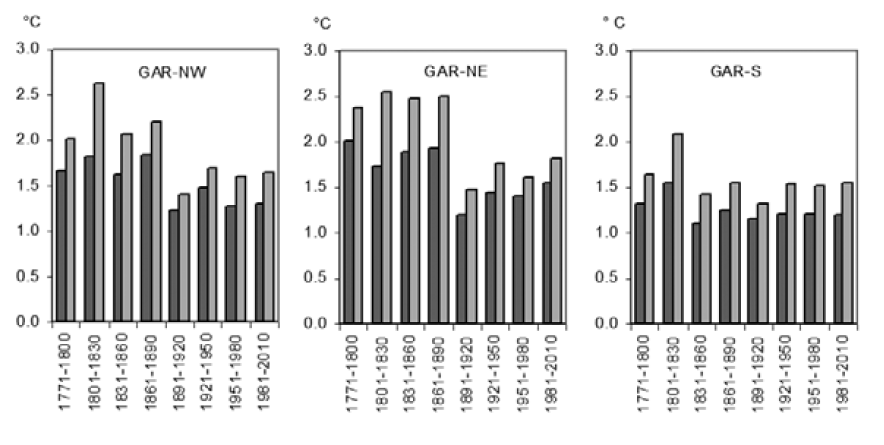
The annual trend in the variability of temperature is negative and statistically significant for the regions North-West (left panel) and North-East (middle), but not for the Southern region (right). Böhm does not stress this remarkable result. Thus I would speculate that he seems not to trust this too much at this stage.
One thing that should be noted here is that the HISTALP dataset has been homogenized for jumps in the mean, but not for jumps in the variability. Thus it is possible that part of the change in the variability is non-climatic. It would be nice to homogenize the HISTALP dataset with CLIMATOL, a homogenization method that is designed to homogenize both the mean and the variance.
These findings should be reproduced in well-homogenized datasets for other regions; global trends can be different from regional ones. From a time series analysis perspective, the 30-year smoothing scale to remove the mean is somewhat arbitrary, if typical in climatology. The analysis could be repeated for multiple time scales and it should be carefully studied whether the variability estimates are unbiased at the edges of the data (where less data is available to compute the mean and thus more variability may be removed as in the middle).
It would be great to perform a similar analysis on daily dataset whose complete distribution has been homogenized. That would allow to analyse the variability after averaging over a range of time scales. Looking at possible causes for changes in the variability, it seems possible that the variability increases at small temporal and spatial scales, while it decreases at large scales. Consequently, also performing such an analysis on a range of spatial scales would be interesting. Another reason why it is interesting to investigate multiple scales is in case a pattern shifts. For example, if the storm tracks would move, one would see a change in variability locally, but it may not make a difference seen over larger area.
Concluding, there is lots of interesting work to do on climate intermittence. As far as I can see, much still has to be done.
Post Scriptum. If you know further papers on changes in the variability of the climate (in any climatic element), whether data analysis, theoretical or modelling please let me know or comment below (also anonymous comments are possible). Also papers studying changes in the mean and in (moderate) extremes on the same dataset would provide similar information and would be very helpful. Because the word climate variability is already used for something else, it is difficult to search for papers in bibliographical databases.
Related posts
- Future research in homogenisation of climate data – EMS 2012 in Poland
- A discussion on homogenisation at a Side Meeting at EMS2012
- What is a change in extreme weather?
- Two possible definitions, one for impact studies, one for understanding.
- HUME: Homogenisation, Uncertainty Measures and Extreme weather
- Proposal for future research in homogenisation of climate network data.
- Homogenization of monthly and annual data from surface stations
- A short description of the causes of inhomogeneities in climate data (non-climatic variability) and how to remove it using the relative homogenization approach.
- New article: Benchmarking homogenization algorithms for monthly data
- Raw climate records contain changes due to non-climatic factors, such as relocations of stations or changes in instrumentation. This post introduces an article that tested how well such non-climatic factors can be removed.
References
Böhm, R. Changes of regional climate variability in central Europe during the past 250 years. The European Physical Journal Plus, 127, no. 54, doi: 10.1140/epjp/i2012-12054-6, 2012.Hansen, J., M. Sato, and R. Ruedy. Perception of climate change. Proc. National. Academy of Sciences, 109, no. 37, doi: 10.1073/pnas.1205276109, 2012.
Hausfather, Z. On Climate Change and Temperature Variance: A Discussion of the paper "Perception of Climate Change" by Hansen et al. [2012]. Berkeley Earth Surface Temperature Project memo, 2013.
Wickenburg, S. Analysis of the Methods used in "Perception of Climate Change" [Hansen et al., 2012]. Berkeley Earth Surface Temperature Project memo, 2013.
No comments:
Post a Comment